In deviated and horizontal wells, the rod string doesn't hang straight. It rests against the tubing wall at every bend, creating lateral forces called side loads. These forces drive tubing wear, rod fatigue, and guide failures. Understanding where they occur and how large they are is the difference between a rod string that runs for years and one that fails in months.
PetroBench calculates side loads as part of every rod string simulation. This article covers how to read those results, what the numbers mean, and how to act on them.
What side loads are
A side load is the lateral force exerted by the rod string against the tubing at a given depth. It's a function of the rod tension, the wellbore curvature at that point, and the weight of the rod below.
Higher dogleg severity means sharper bends. Sharper bends mean greater lateral force. In a vertical well, side loads are essentially zero. In a well with a 5 deg/100ft build section, they can exceed several hundred pounds at specific contact points.
Side loads matter because they:
- Accelerate tubing and rod wear at contact points
- Increase polished rod load and energy consumption
- Cause rod guide failures and potential rod parts
- Limit the pump speed you can safely run
Where to find side load results in PetroBench
After running a simulation in RodSim, open the Results tab. The results page has three main visualization areas:
- Dynamometer card: surface and downhole cards showing load vs position
- Side Loading chart: lateral force per rod vs measured depth
- Axial Loading chart: tension and compression forces along the string
The Side Loading chart is the primary tool for evaluating rod guide placement and tubing wear risk.
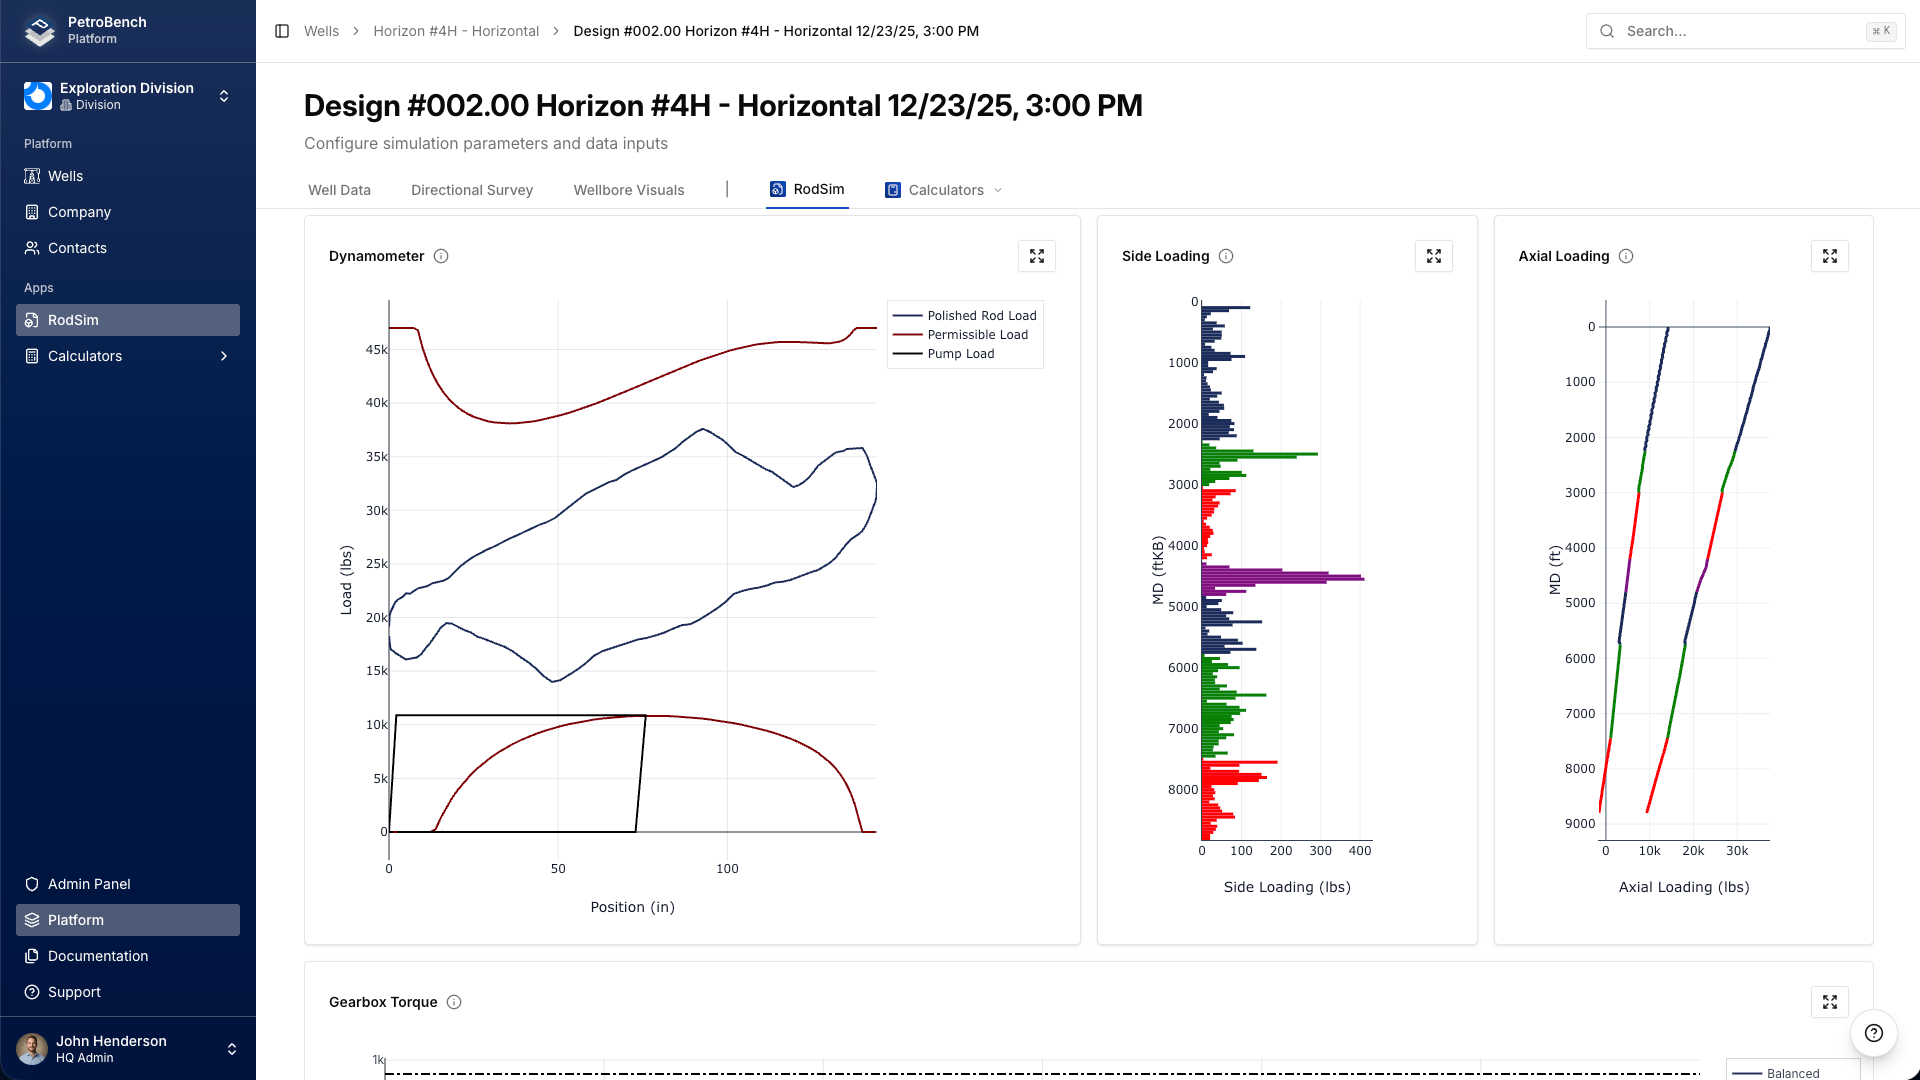
Reading the Side Loading chart
The Side Loading chart plots lateral force (in pounds) on the x-axis against measured depth on the y-axis. Each data point represents the side load at a specific rod joint.
Key things to look for:
- Peak values: the highest force points along the string. These are your primary wear locations.
- Depth of peaks: peaks typically align with the build and drop sections of the wellbore.
- Distribution: a single sharp spike is more concerning than a gradual rise. Concentrated loads mean concentrated wear.
- Upstroke vs downstroke: side loads change throughout the pumping cycle. PetroBench shows the maximum value at each depth.
Hover over any point on the chart to see the exact force value and depth. This is useful when you need precise numbers for rod guide spacing decisions.
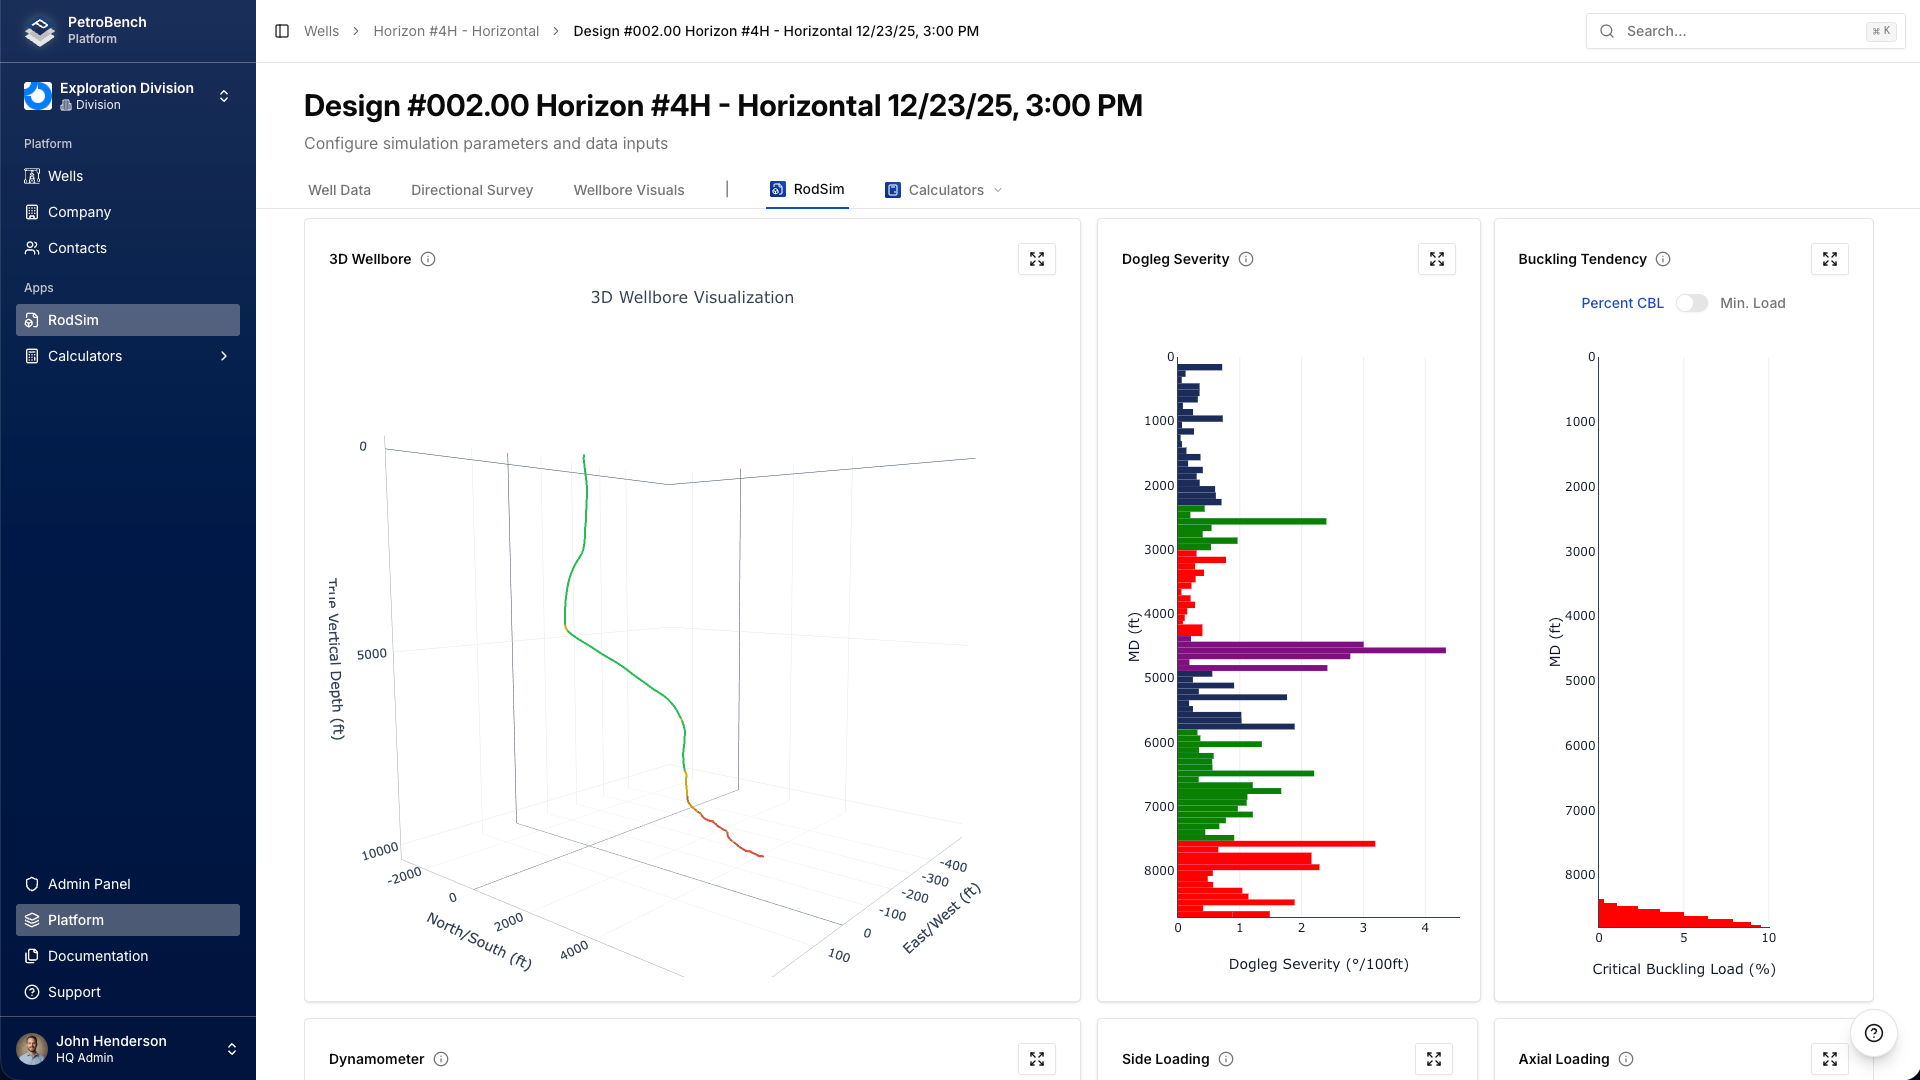
Dogleg severity and side load correlation
Dogleg severity (DLS) is the rate of wellbore curvature, measured in degrees per 100 feet. It's the single biggest driver of side loads.
PetroBench displays DLS alongside the 3D wellbore visualization in the Wellbore Visuals section. The dogleg severity chart and the side loading chart share the same depth axis, making it easy to cross-reference peaks.
General relationship:
- DLS under 2 deg/100ft: side loads are typically manageable with standard guide spacing
- DLS 2-5 deg/100ft: tighter guide spacing required, possibly every joint
- DLS above 5 deg/100ft: guides on every joint, consider continuous rod or alternative lift methods
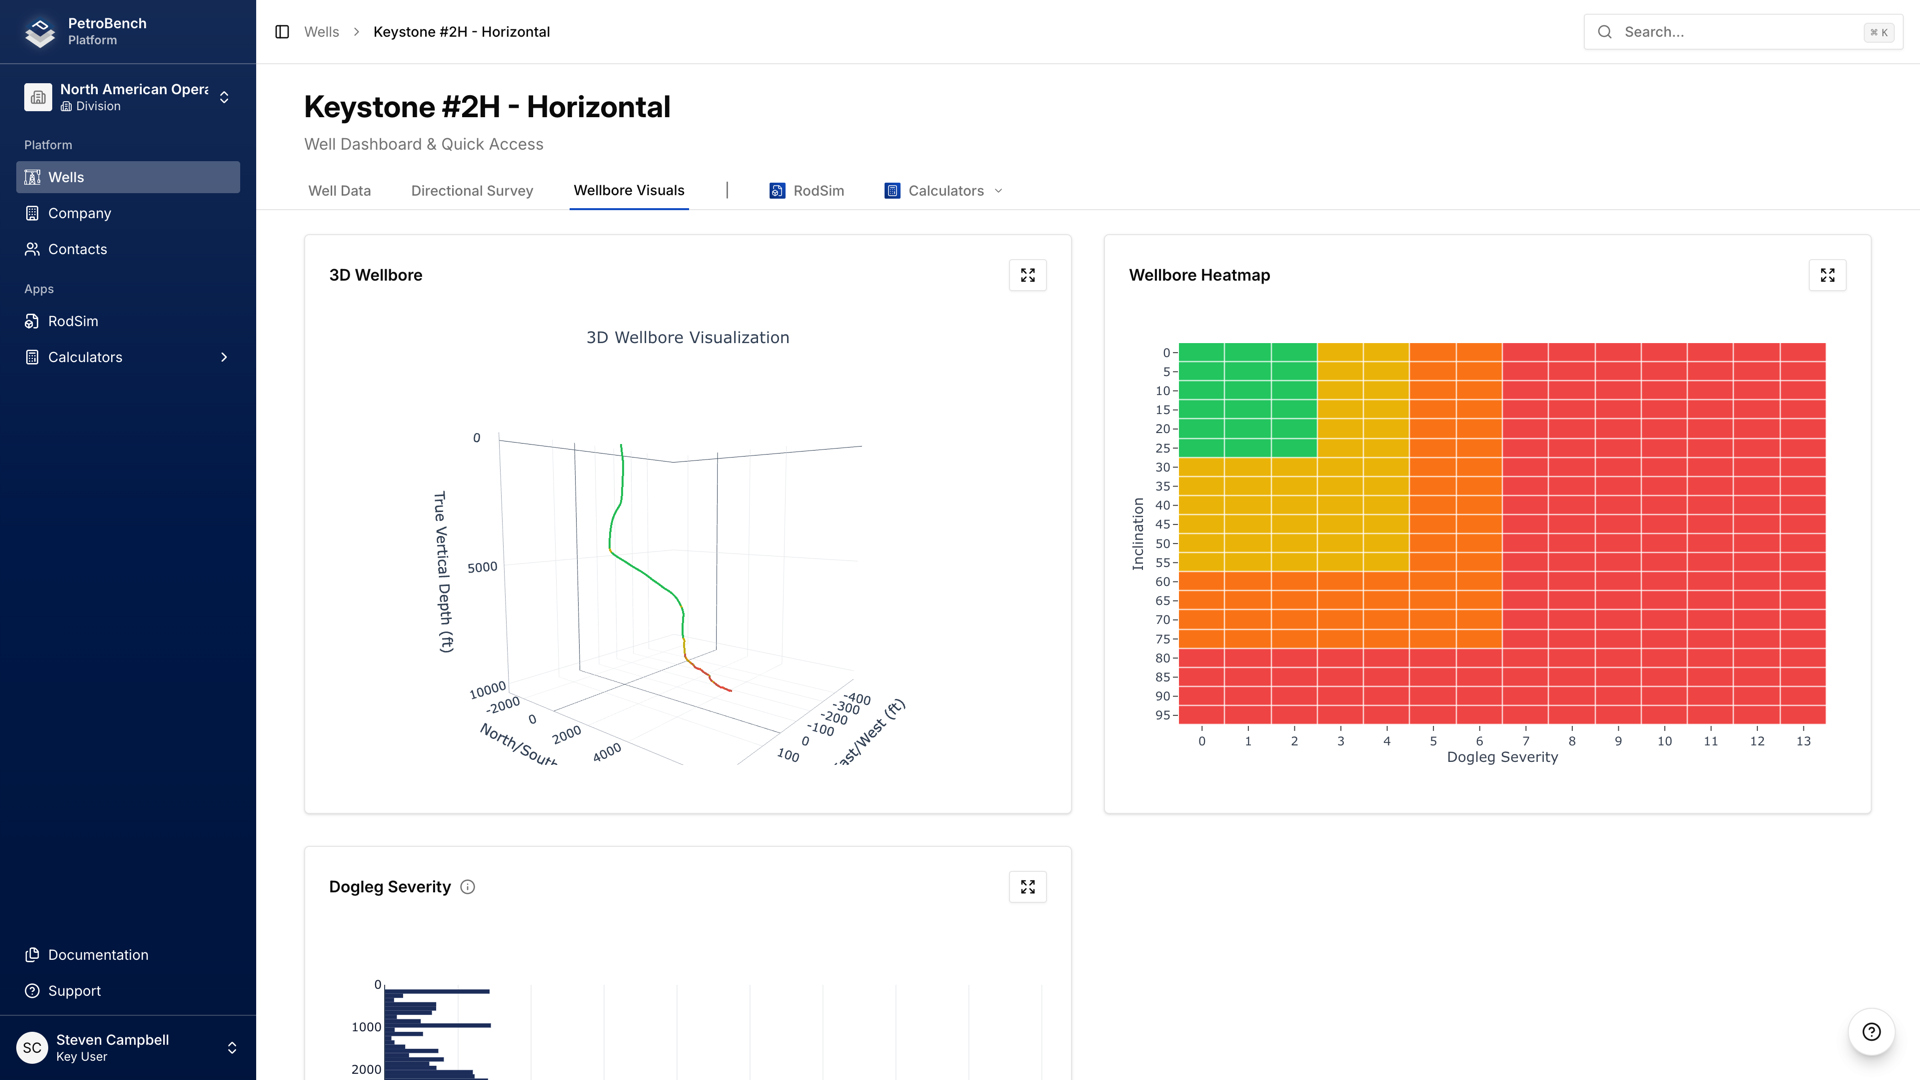
You can also view the wellbore trajectory and DLS from the Well Details page before running a simulation. The heatmap overlay on the 3D wellbore view highlights high-DLS zones.
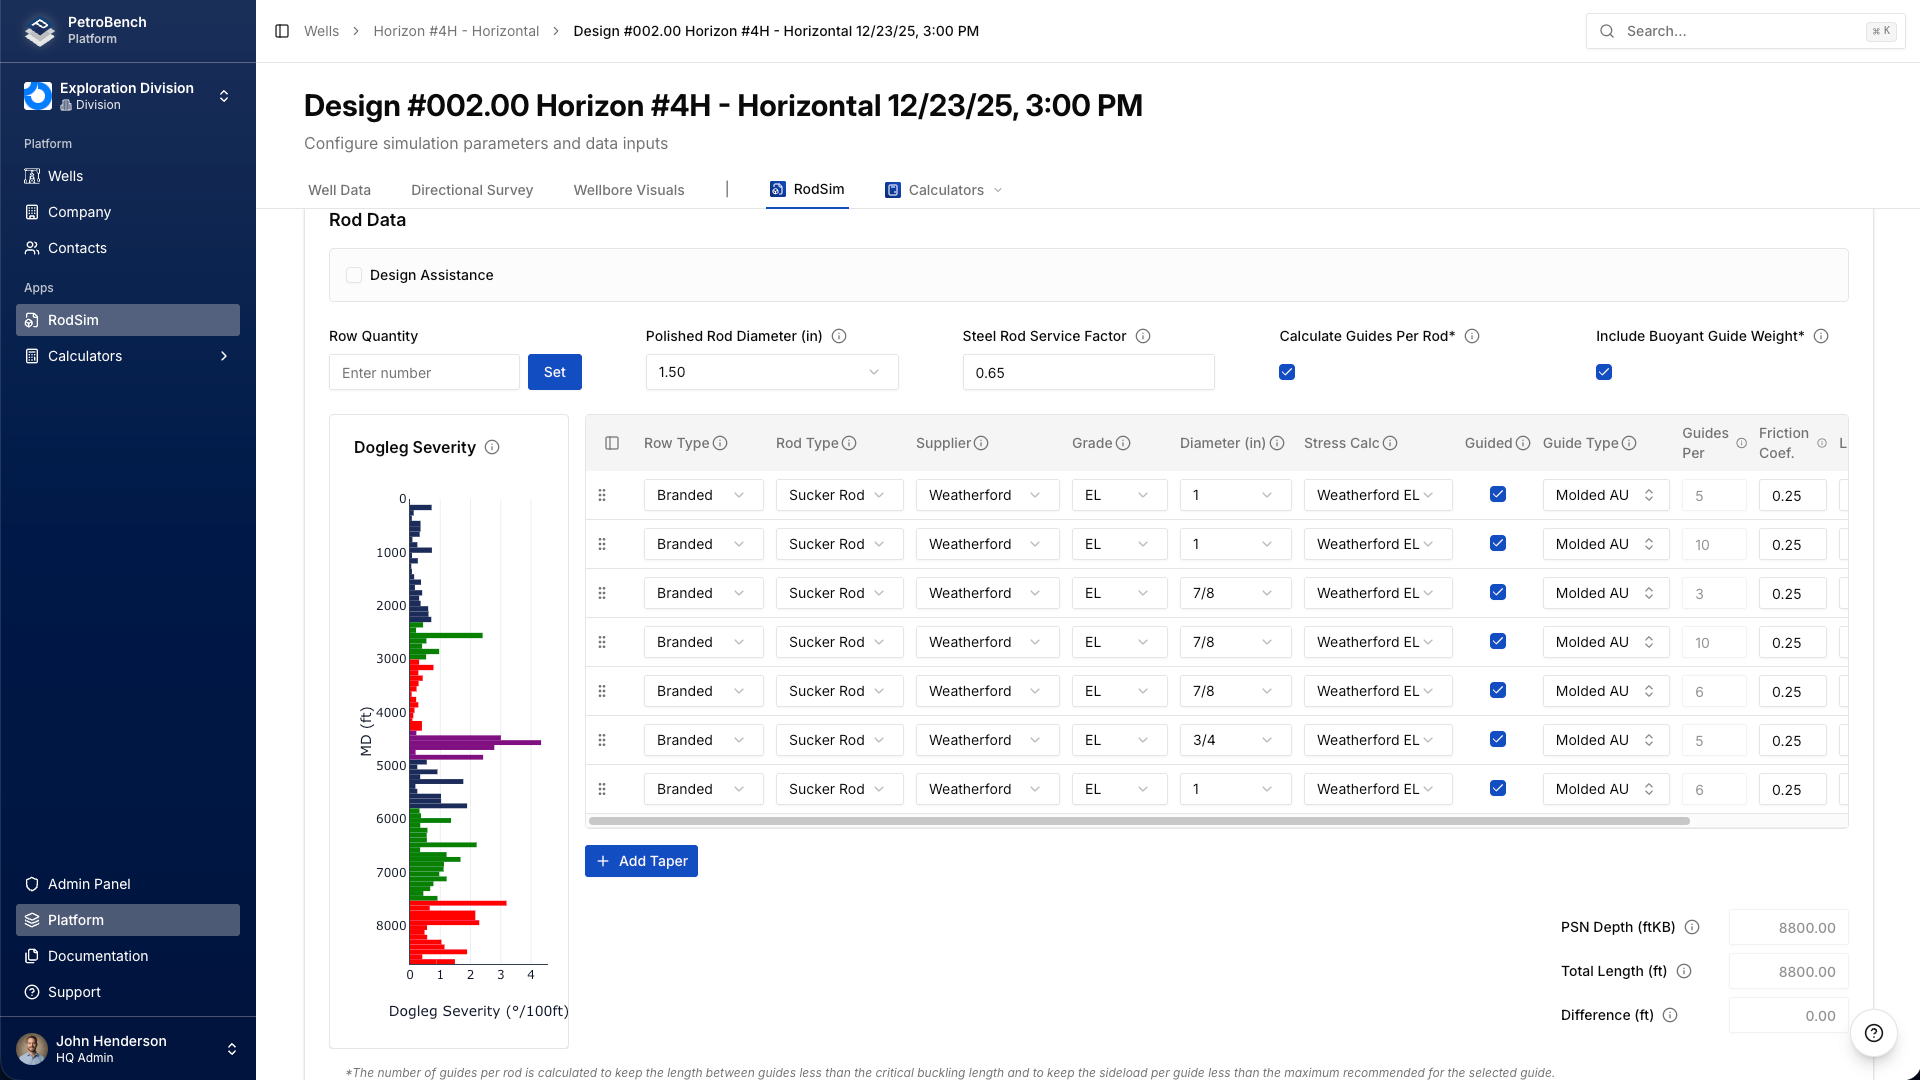
Placing rod guides using side load results
Rod guides prevent metal-to-metal contact between the rod body and tubing. Placement decisions should be driven by the simulation data, not just rules of thumb.
Use this approach:
- Identify every depth where side load exceeds 200 lbs on the chart.
- Cross-reference those depths with the dogleg severity profile to confirm they align with high-curvature zones.
- Place guides on every rod joint in the high side load zone, plus two joints above and below as a buffer.
- For zones between 100 and 200 lbs, use guides on every other joint.
- Below 100 lbs, standard spacing (every third or fourth joint) is typically sufficient.
PetroBench's Design Assistance panel in the Rod Data tab can help with this. It shows the dogleg severity alongside your rod string configuration, so you can see exactly which joints fall in high-curvature zones.
The 200-lb threshold
The industry commonly uses 200 lbs as the threshold above which rod guides are required on every joint. This isn't a hard physical limit. It's a practical guideline based on decades of field experience with conventional rod guide materials.
Context matters:
- Corrosive environments: lower your threshold. Side loads combined with corrosion accelerate failures exponentially.
- High-temperature wells: guide material degrades faster. Consider tighter spacing even below 200 lbs.
- Premium guides: metallic or spray-metal guides can tolerate higher loads. You may raise the threshold to 300+ lbs with premium materials.
- Sandy production: abrasive particles chew through guides faster. Be more aggressive with placement.
Use the 200-lb rule as a starting point, then adjust based on your operating conditions and failure history.
When to add sinker bars
Sinker bars add weight to the bottom of the rod string. In deviated wells, they serve a dual purpose: they help keep the pump plunger loaded on the downstroke, and they change the tension distribution along the entire string.
Adding sinker bars affects side loads in two ways:
- Increased tension below: higher tension through the build section can increase side loads in that zone
- Reduced buckling: in the lateral section, added weight reduces the likelihood of rod buckling, which can cause its own contact forces
Consider sinker bars when:
- The axial loading chart shows compression (buckling) in the lower rod string
- Pump fillage is poor and the plunger isn't loading properly on the downstroke
- You're seeing rod parts in the tangent or lateral section
Run the simulation with and without sinker bars to compare the side load profiles. PetroBench makes this simple since you can modify the rod string and re-run without starting over.
Comparing side loads across rod string designs
Different rod string configurations produce different side load profiles in the same well. Changing rod diameter, taper lengths, or material grade all shift where and how much lateral force develops.
Common comparisons:
- Heavier rods in the build section: increases side loads but may reduce fatigue stress. Check whether the tradeoff is favorable.
- Lighter rods at the bottom: reduces overall string weight and can lower side loads through curved sections above.
- Fiberglass vs steel: fiberglass rods are lighter and produce lower side loads, but have different fatigue characteristics.
Save each configuration as a separate simulation version in PetroBench. The Version History feature lets you compare results side by side, including the side load charts. This is the fastest way to evaluate design alternatives without losing your previous work.
Putting it together
Side load analysis isn't optional in deviated wells. It's the foundation of rod guide placement, string design, and failure prevention. The simulation does the heavy math. Your job is to know what the results mean and how to act on them.
Start with the side loading chart. Find the peaks. Cross-reference with dogleg severity. Place guides where the data tells you to. Run comparisons when you're evaluating design changes. The 200-lb threshold is your baseline, but adjust it for your conditions.