PetroBench V2 is live and the Professional package is available for independent operators and consulting engineers. This is not a scaled-down enterprise product. It is a purpose-built plan for engineers who run their own wells and need reliable simulation without the overhead of team-scale software.
Here is a detailed walkthrough of what Professional includes and how each capability applies to rod lift design work.
The wellbore model is more accurate now
The simulation engine uses cubic spline interpolation to model the wellbore path between survey points. Legacy tools typically use linear interpolation - straight-line segments between survey stations that approximate the actual wellbore trajectory.
In deviated wells with build sections, doglegs, and direction changes, the wellbore path between survey stations follows a curve. Linear interpolation treats each interval as a straight segment and introduces discontinuous angle changes at station boundaries. These artificial discontinuities produce stress concentrations in the simulation that do not exist in the actual wellbore.
The magnitude of this error increases with dogleg severity and survey spacing. At 6 degrees per 100 feet with 100-ft survey intervals, the predicted contact force at a station boundary can differ by 10 to 20 percent between linear and cubic spline methods. That difference is enough to change rod guide placement decisions and taper transition locations.
Cubic spline interpolation fits a continuous curve through the survey points, matching position, direction, and curvature at each station. The resulting trajectory is smooth and differentiable everywhere, which eliminates the artificial stress concentrations that linear methods introduce at station boundaries.
Step length is configurable down to 10 feet, compared to the 50-ft default in most legacy tools. In wells with tight build sections, 10-ft resolution with cubic spline geometry resolves side load peaks that coarser models average out. Rod guide placement based on 50-ft linear interpolation can miss the actual contact force peak by 50 to 100 feet.
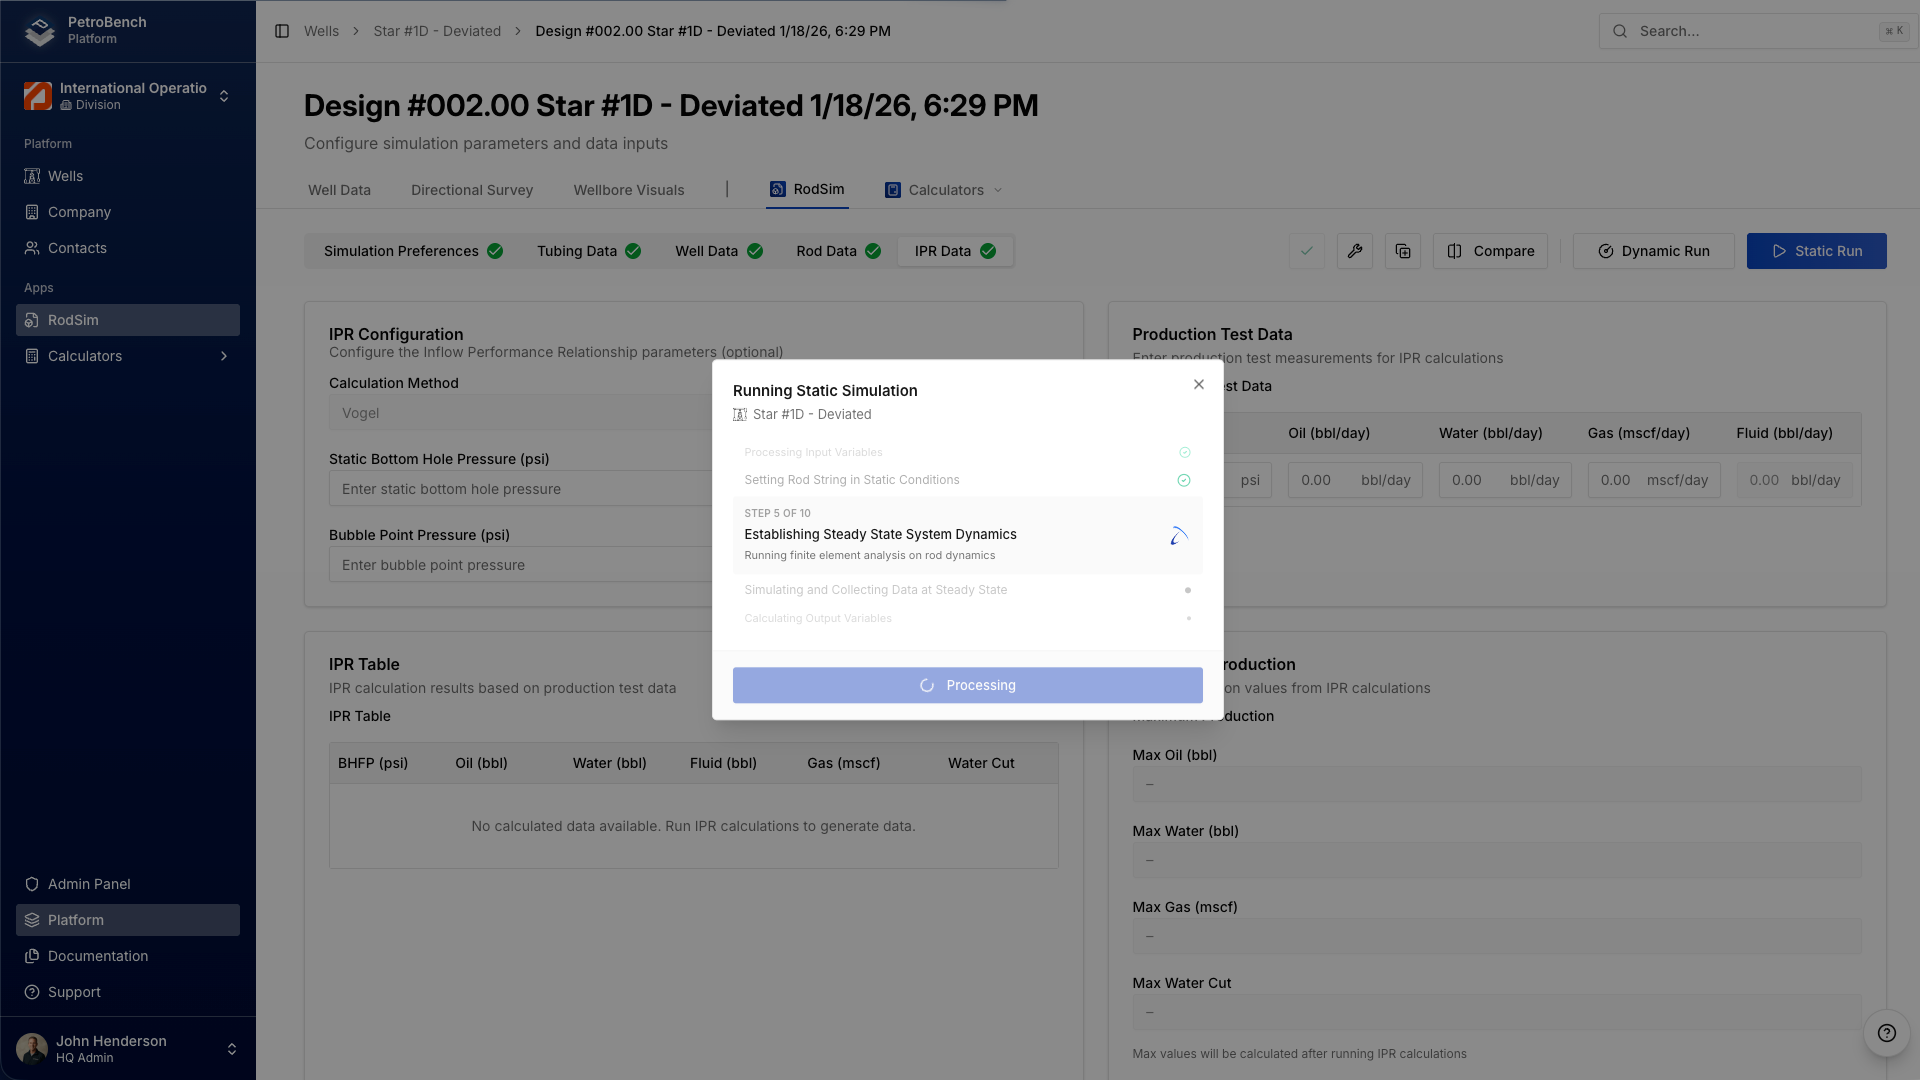
You can compare three designs without leaving the well
Professional has a comparison view that puts up to three rod string configurations side by side - peak polished rod load, minimum rod load, gearbox loading, structural loading, stress at each taper section. All three designs, all key metrics, one screen.
The iterative base case workflow is what makes this practical for real design optimization. After comparing three configurations, you promote the best-performing scenario to the new base case and run a fresh comparison. Test three taper configurations, select the best, then test three stroke speeds on that taper, then three rod grades. Each round refines the design without losing the record of previous iterations.
In a traditional desktop workflow, comparing three configurations requires opening three separate files, running three independent simulations, and manually aligning the results for comparison. That process typically takes 30 to 45 minutes per comparison cycle.
In RodSim, the same comparison takes approximately 15 minutes and the results are stored as part of the well record. For engineers who routinely evaluate multiple design options, this removes the overhead that makes thorough comparison impractical under field schedule pressure.
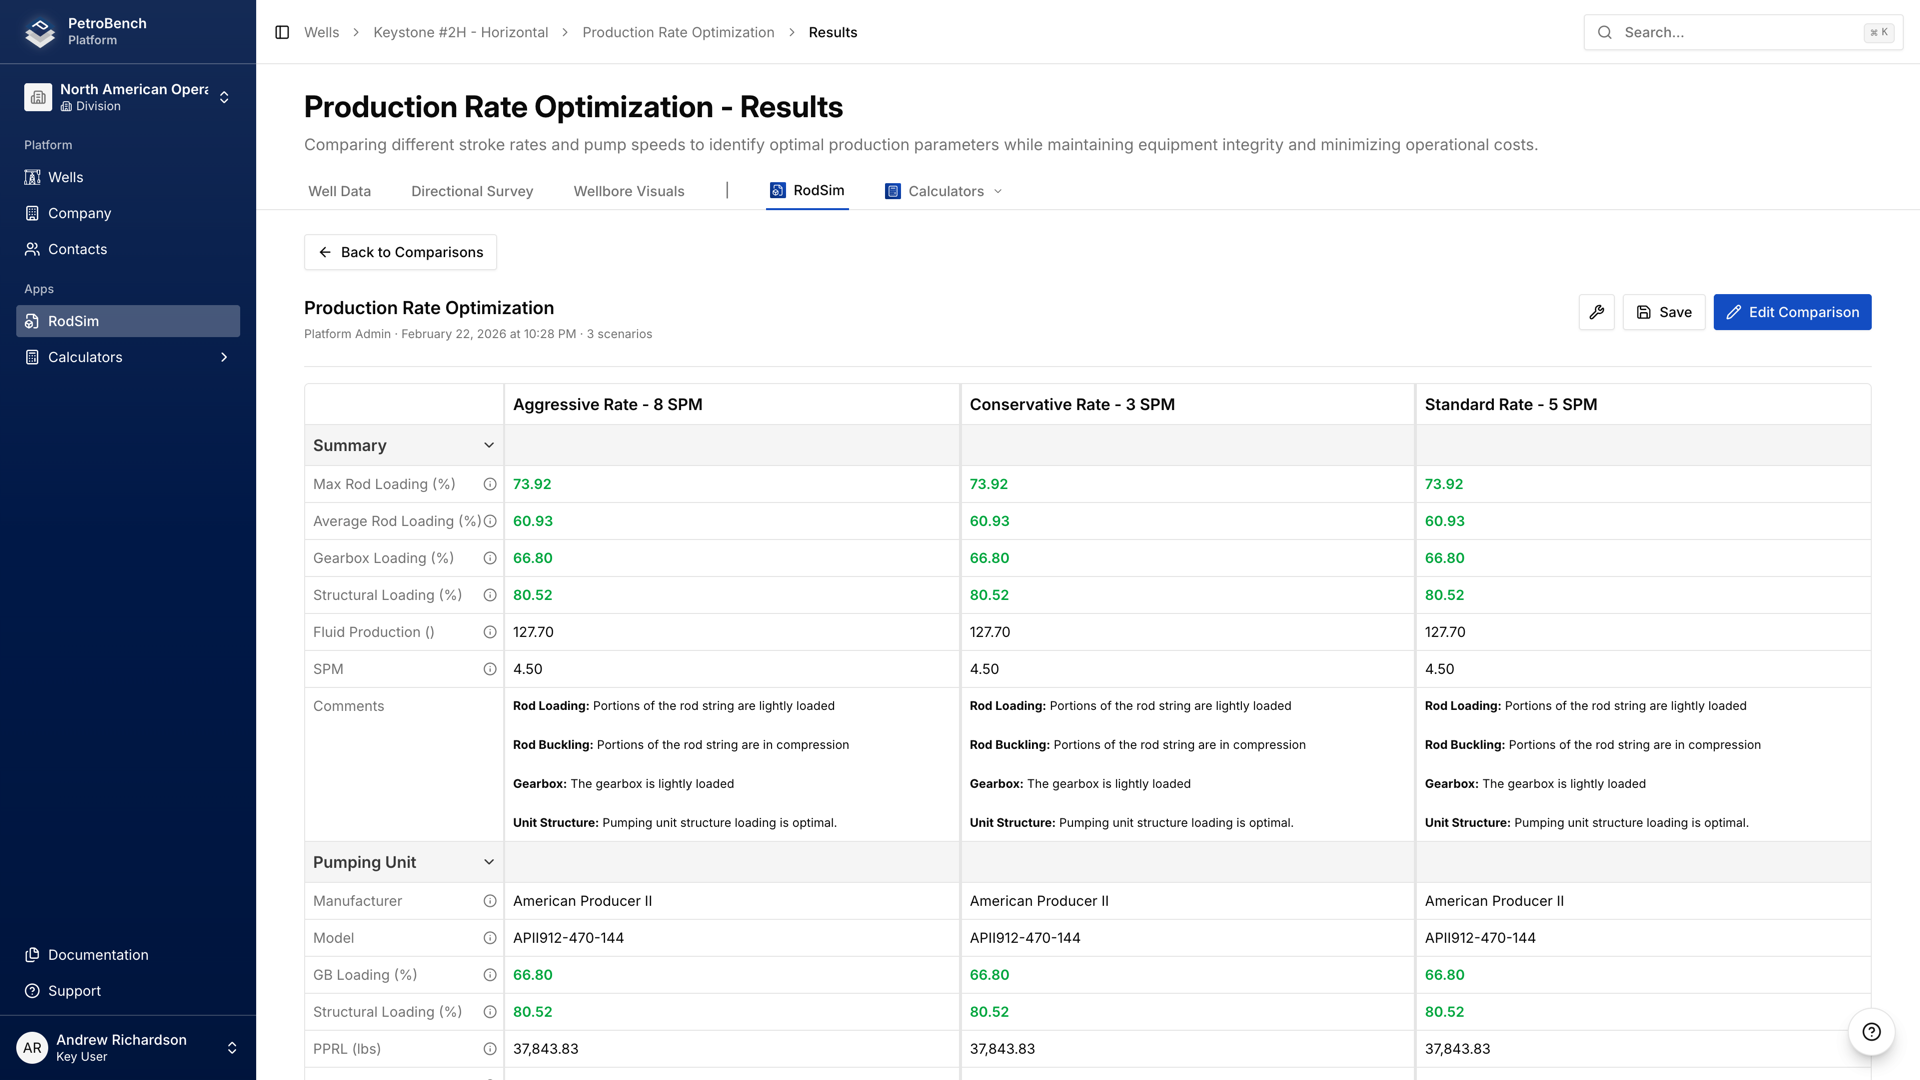
Rod tapers visualized against the wellbore geometry
The rod data screen has a design assistance panel that color-codes your taper sections on the dogleg severity graph. You can see exactly where each section of the rod string sits relative to the build, turn, and tangent sections of the well.
Taper transitions are common failure locations, and their position relative to high-dogleg zones determines how much cyclic bending stress they accumulate. A taper transition in the middle of a 5-degree-per-100-ft dogleg can exceed the Goodman fatigue limit even when the overall design appears conservative. The design assistance panel makes these overlaps visible at the design stage rather than after a rod failure in the field.
The panel also identifies zones with the highest rod-tubing contact forces, which helps target rod guide and centralizer placement to locations where they provide measurable wear reduction.
You can save rod string configurations as personal templates. If you have a 7/8-3/4 Grade D taper that works across a class of wells in your field, save it once and apply it to the next similar well without re-entering everything. Modify as needed, but start from a proven baseline.
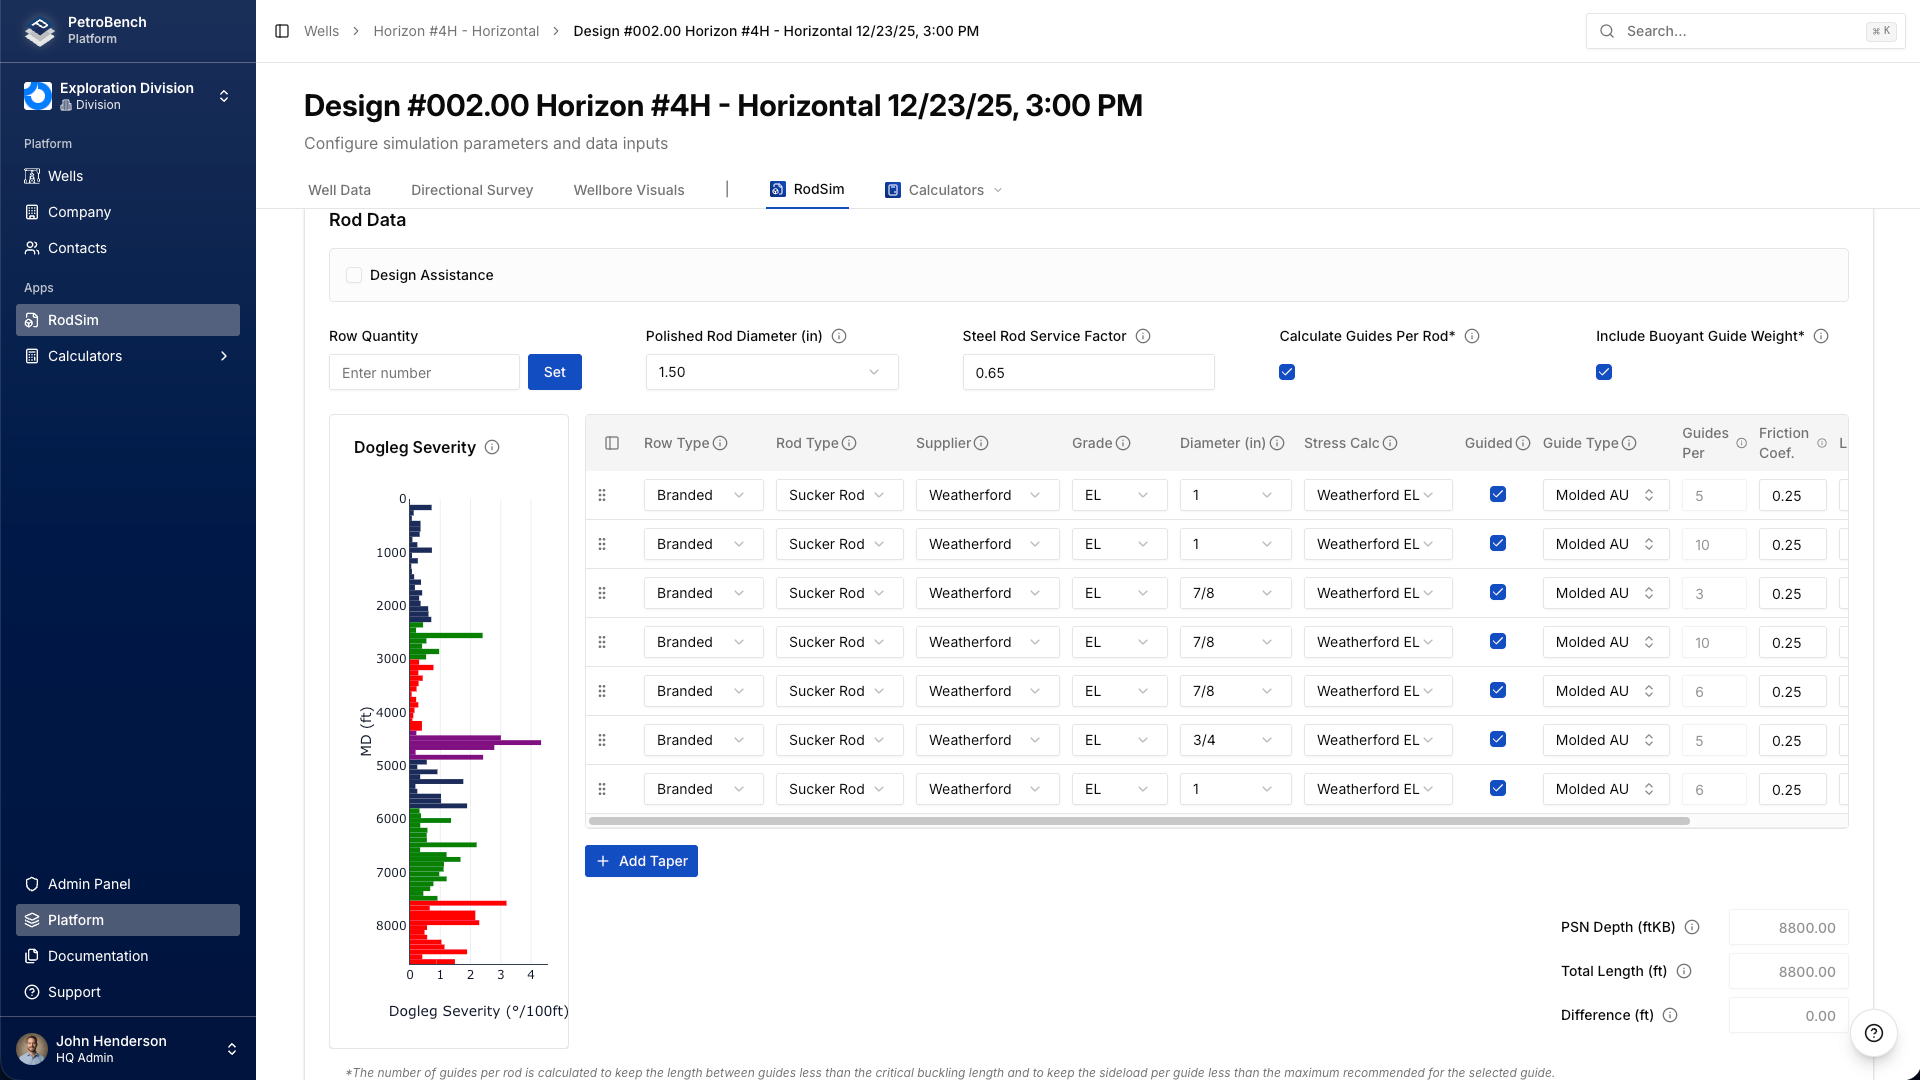
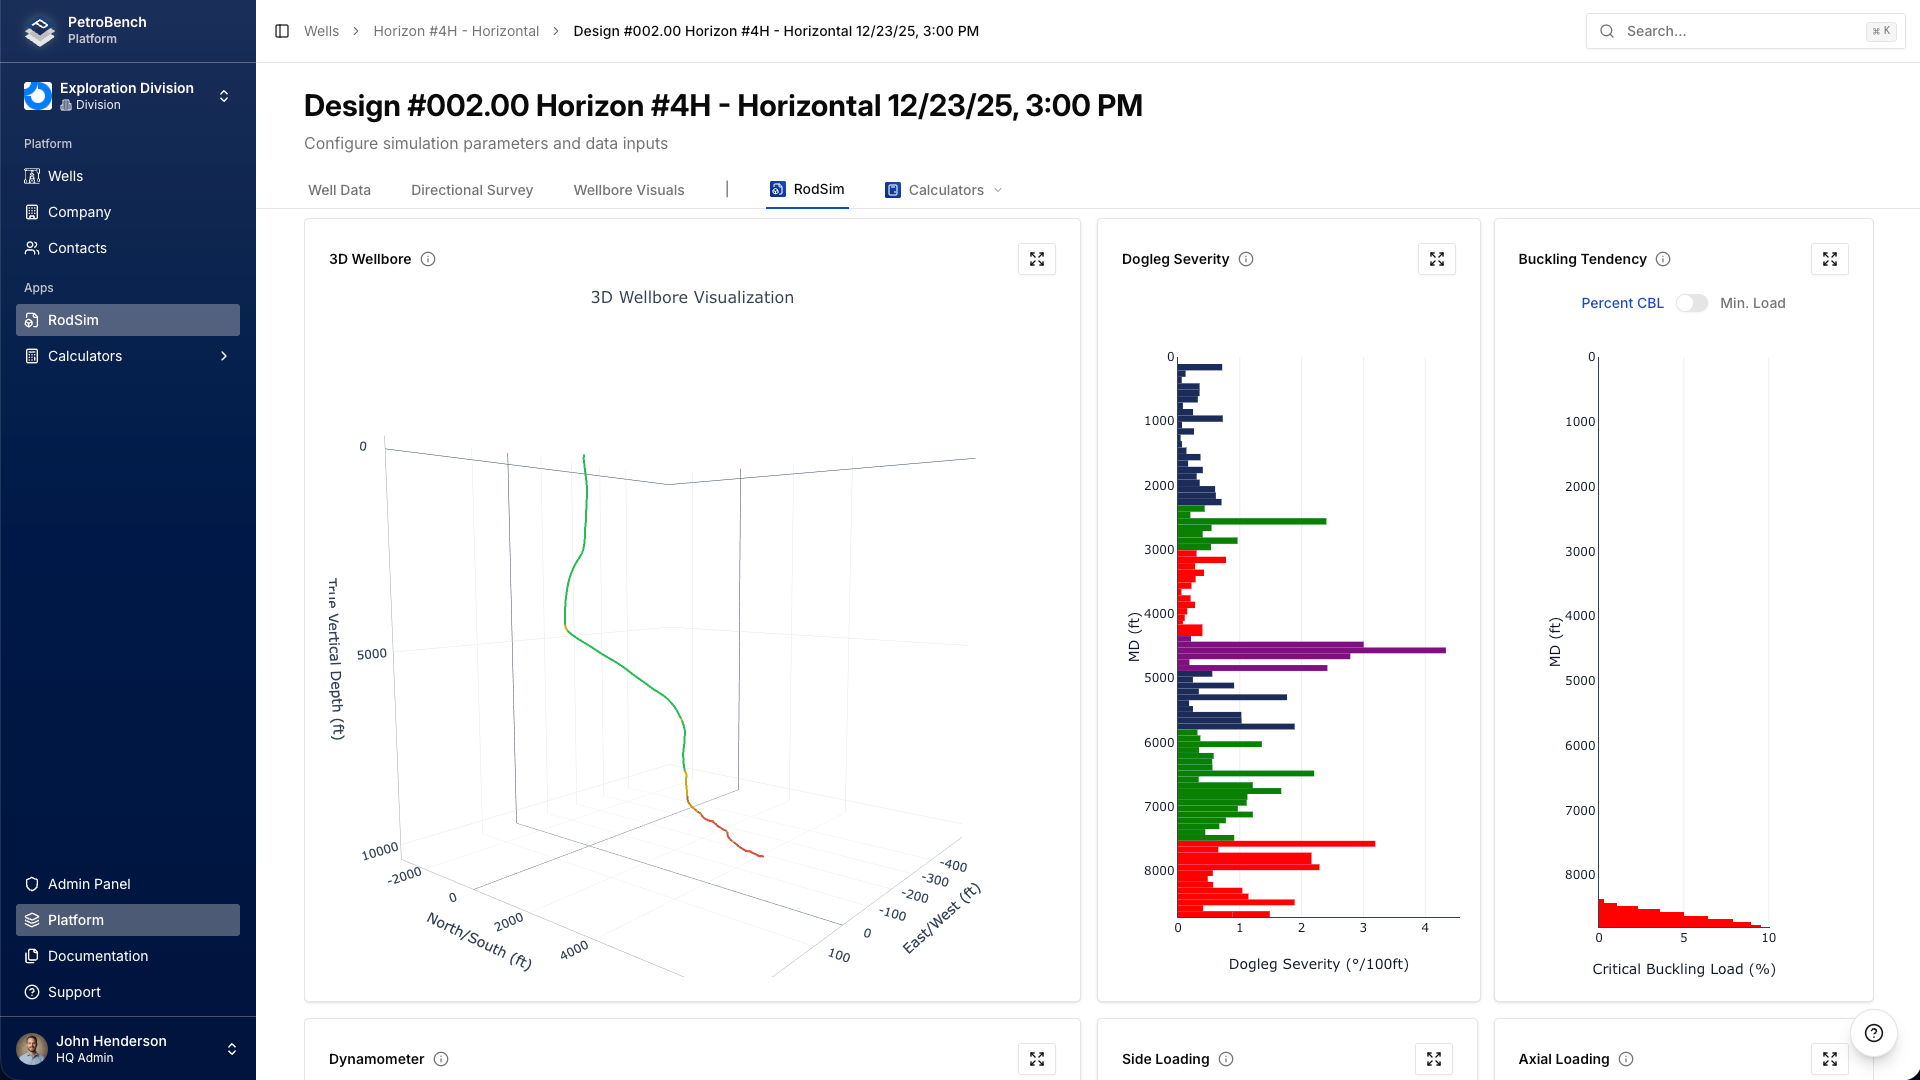
Results that are ready to send
The results screen in V2 consolidates calculated metrics, tubing and casing data, and pumping unit analysis into a single layout. Key design checks and recommendations are visible without navigating between tabs.
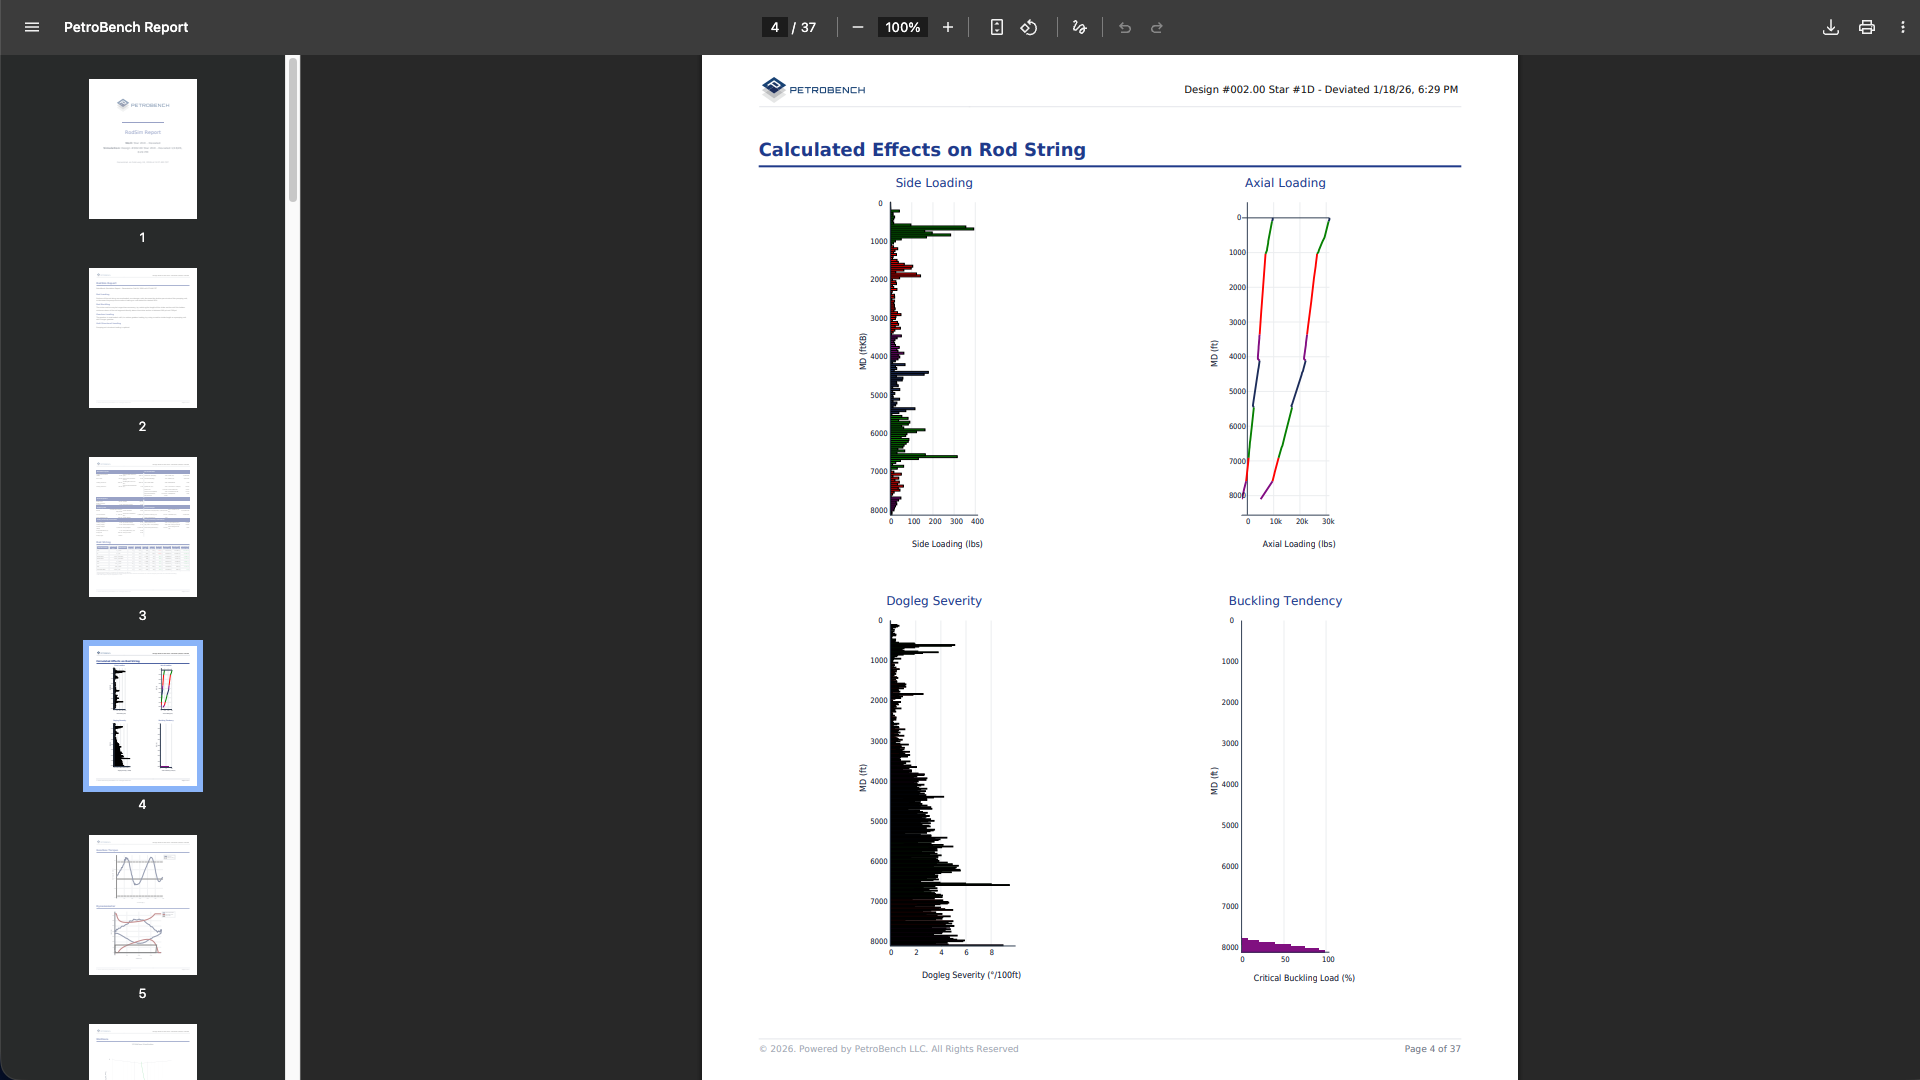
The wellbore loading view renders rod string forces along the actual trajectory of the well - where tension is highest, where compression starts, where the rod contacts the tubing, where buckling tendency peaks. The 3D wellbore visualization lets you rotate the well, zoom into the build section, and read off dogleg severity, inclination, and azimuth at any depth with a tooltip.
Dynamometer cards - surface and downhole - sit alongside the rod loading profiles. If dynacard analysis is part of your diagnostic workflow, having the simulated cards next to the stress data means you are not flipping between screens or exporting to another tool.
PDF export produces reports with charts formatted for delivery to clients, management, or peer review. No intermediate step of copying numbers into Word or pasting charts into a template. You select the report type - standard, detailed, or comparison - and the PDF is ready to send.
Bring your existing wells with you
RodSim imports legacy design files directly. Well data, directional surveys, rod string configurations, and operating parameters transfer without manual re-entry. Excel and CSV survey files import with automatic column detection.
The recommended evaluation approach: import three to five wells that you have already designed in your current tool, run the simulations in RodSim, and compare the outputs. Both platforms solve the same wave equation. The results should converge. Where they differ, the cause is typically a unit convention or default parameter value that is straightforward to identify.
Once the simulation results are validated, the workflow advantages become clear. All designs are in a single structured environment. Scenario comparisons do not require managing multiple files. Reports generate directly from simulation results. And the platform is accessible from any device with a browser.
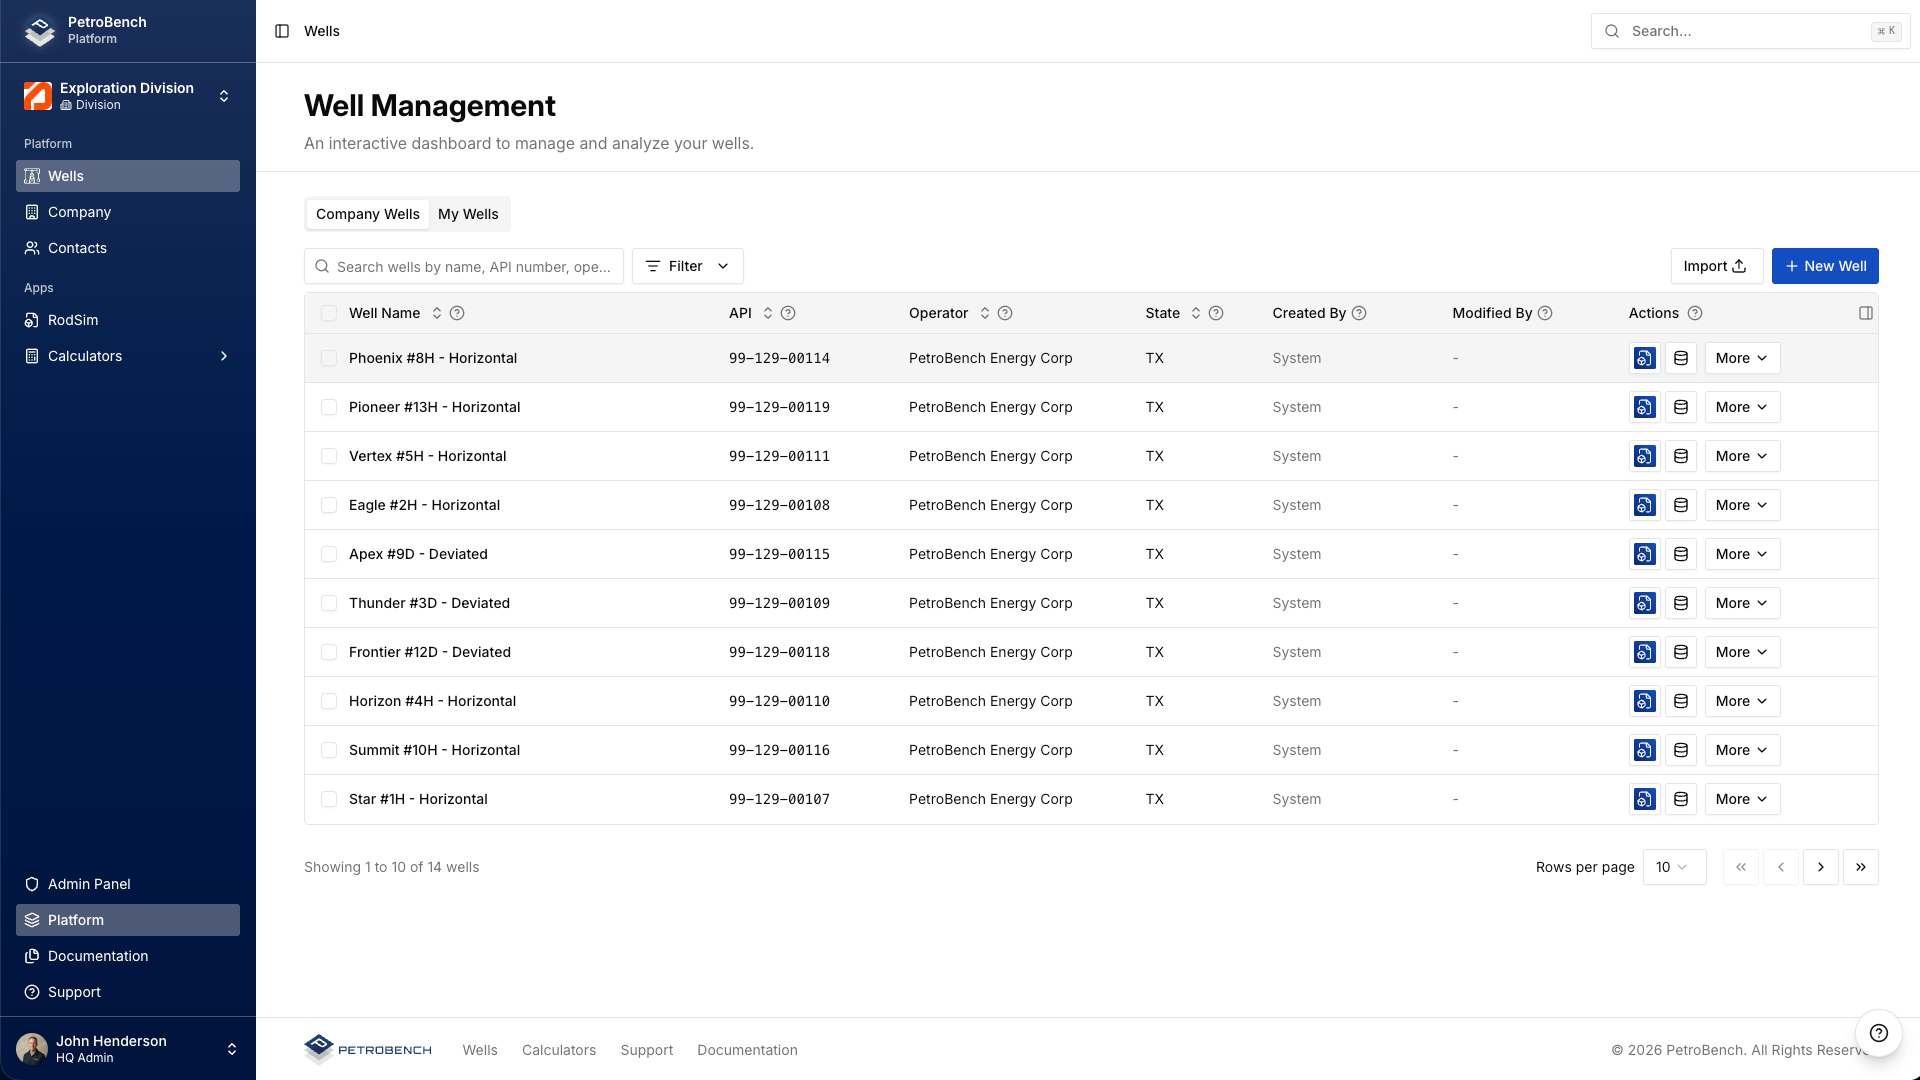
Everything in one dashboard
All wells and designs are searchable and filterable from a central dashboard. The built-in calculator suite - pump slippage, production rate, sheave size, stroke rate, flow velocity, hydraulic lift, foam column density - is accessible from the same environment, eliminating the need to switch between applications for routine production calculations.
Every rod lift engineer who manages more than a handful of wells has spent time looking for the right version of a design from three months ago. The dashboard eliminates that problem. Search by well name and everything is there - the design, the simulation results, the comparison, the exported report.
How to get started
Professional is available now with V2 launch pricing. Annual and monthly billing options are both available. Pricing details and account creation are at petrobench.com/professional.
For engineers who prefer to evaluate the platform before committing, we offer 30-minute technical walkthroughs using your actual well data. These are working sessions led by an engineer, not sales presentations. Scheduling is available from the same page.